Chandigarh Sector 17 vs 22 vs 43: A Factor-by-Factor Nexscore Comparison
Three of Chandigarh's highest-scoring central sectors, compared factor by factor on real Nexscore data — not just their overall numbers.
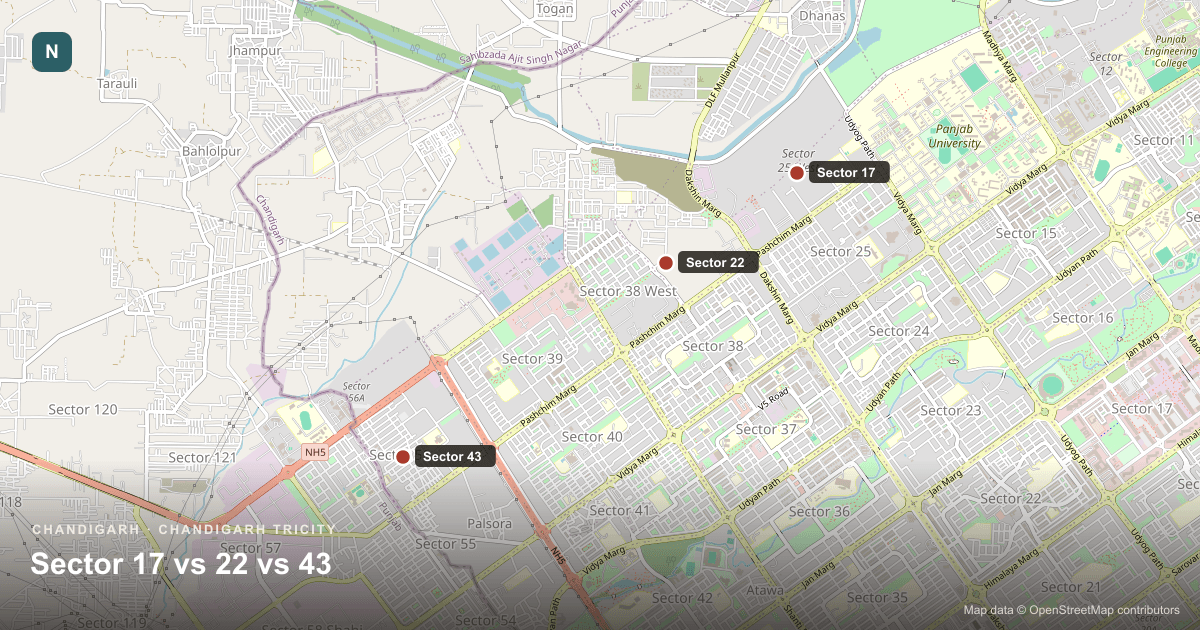
Sector 17, Sector 22 and Sector 43 sit close together in Chandigarh’s original grid and consistently score among the highest overall Nexscore values in the Tricity. That closeness makes them a genuinely useful case for a factor-by-factor comparison rather than a “which is better” verdict — the differences that matter are specific, not general.
Sector 17
Chandigarh’s commercial and civic centre — the reference point most other Tricity localities get compared against.
Sector 22
A residential-commercial mix a short distance from Sector 17, generally considered one of Chandigarh’s most settled, mature sectors.
Sector 43
Home to the ISBT (interstate bus terminal) and one of the better-connected sectors in the city.
What actually differs between them
Connectivity is the factor that genuinely separates these three — look at the numbers above side by side rather than just the overall score. Flood risk, by contrast, doesn’t differentiate them at all: all three currently carry the identical flood-risk score, so it’s not a useful tie-breaker between them even though it’s a real, meaningful factor when comparing against sectors elsewhere in the Tricity. Air quality is in the same position as flood risk here, for a different reason — it’s currently one regional signal rather than sector-specific monitoring (see the limitations note above), so it won’t help you choose between them either.
If you’re deciding between these three specifically, the honest next step is checking which one’s connectivity profile matches your actual daily route — that’s the one factor here where Nexscore’s numbers actually track a real difference.
Sources & methodology
- Source
- Nexscore locality API (api.nexlease.in/api/nexscore) — live-queried for this piece
- Data as of
- 21 Aug 2026
- Last updated
- 26 Aug 2026
- Methodology
- Scores below are fetched live from Nexscore's API at build time via this site's shared adapter. This piece compares three sectors that consistently rank close together; it doesn't rank all 17 Tricity localities.
- Limitations
- Building age and amenities aren't in Nexscore's public data for any of these three sectors. Air quality currently reflects one Tricity-wide reading, not per-sector monitoring — treat the connectivity and flood-risk numbers as the real differentiators here.
Frequently asked questions
Which Chandigarh sector has the best Nexscore?
Among the three compared here, it comes down to connectivity specifically — see the live breakdowns above. Flood risk is currently identical across all three, so it isn't what separates them; connectivity is.
Is a higher overall Nexscore always the right choice?
Not necessarily. Nexscore's overall score currently weights three published factors; two more (building age, amenities) aren't in the public data yet, so a locality's true fit for you may depend on things the index doesn't yet measure.