Comparing Flood Risk, Air Quality and Connectivity Across Six Tricity Localities
A six-locality comparison of Nexscore's three published factors across Chandigarh, Mohali, Panchkula and the highway belt — including a real finding about how the air-quality data currently works.
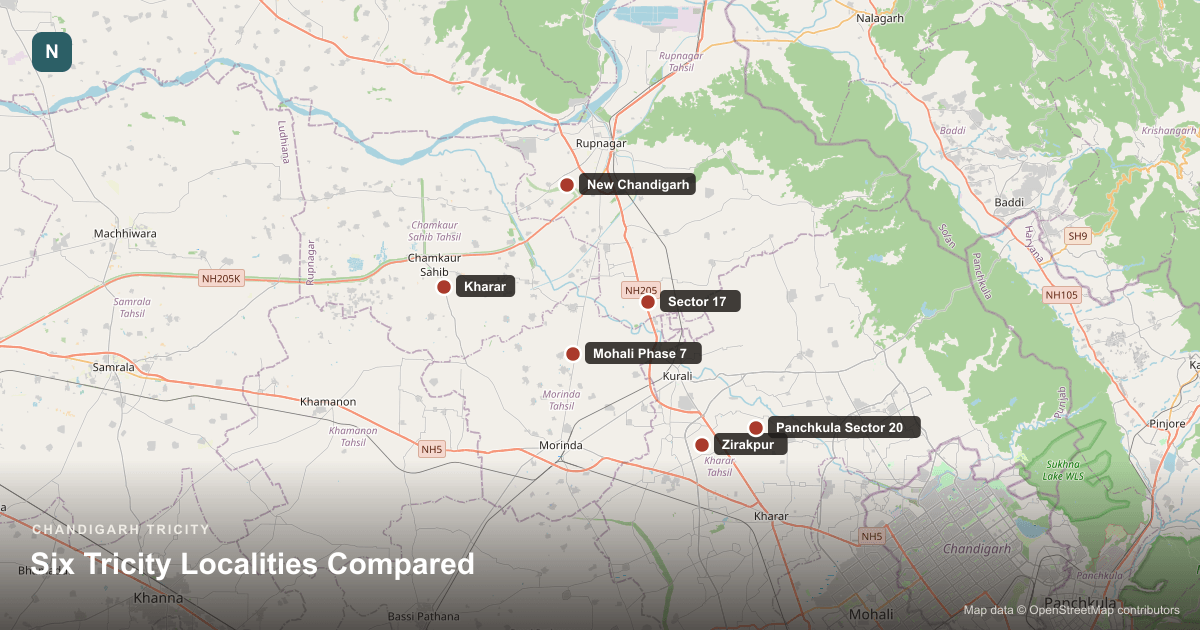
Nexscore publishes three factors for every Tricity locality it tracks — flood risk, air quality and connectivity. Putting six localities that span the Tricity’s main sub-areas side by side in one table surfaces something worth knowing before you use any of these numbers to compare two specific places: one of these three factors isn’t actually differentiated locality-to-locality yet.
The six localities, side by side
| Locality | Nexscore | Flood risk | Air quality | Connectivity |
|---|---|---|---|---|
| Chandigarh Sector 17 | 8.5 | 9 | 6.8 | 9.5 |
| Mohali Phase 7 | 7.9 | 8 | 6.8 | 8.3 |
| Panchkula Sector 20 | 7.7 | 7.8 | 6.8 | 7.8 |
| New Chandigarh | 7.9 | 8.5 | 6.8 | 7.4 |
| Zirakpur | 7.2 | 6.6 | 6.8 | 8.2 |
| Kharar | 7.1 | 7 | 6.8 | 7.2 |
Nexscore column reflects the currently-published factors only — see the limitations note above.
What the flood-risk column actually shows
Flood risk varies meaningfully across these six — the pattern roughly follows elevation and distance from the Tricity’s lower-lying, older-drainage areas. Higher-ground, more recently planned areas score better here than the highway-corridor belt, which lines up with what’s publicly known about Tricity drainage infrastructure rather than contradicting it.
What the connectivity column actually shows
Connectivity also genuinely differentiates these six — central, older-plan sectors close to established transit points score highest, while the highway-growth belt (Zirakpur, Kharar) and the newer outer developments (New Chandigarh) read lower. This is the clearest, most usable signal in the table if commute time is your priority.
What the air-quality column does not show
Look closely at the air-quality numbers above: at the time this table was built, they read close together across the six localities. That’s worth explaining precisely rather than just noting it — Nexscore’s AQI figure currently comes from one regional signal, not monitoring specific to each sector, and the cached copy of that signal doesn’t refresh uniformly across locality requests. In practice that cuts both ways: two localities can show matching numbers because they’re genuinely fed by the same regional reading, or they can show different numbers purely because one request hit a fresher cache than the other. Neither case tells you anything real about one of these six localities having cleaner air than another — the air-quality column simply isn’t a reliable way to differentiate them yet.
The honest takeaway
If you’re using Nexscore to compare Tricity localities today, flood risk and connectivity are doing real work — air quality isn’t yet, and building age and amenities aren’t in the data at all. That’s not a reason to distrust the two factors that are measured well; it’s a reason to be specific about which factor is actually deciding your comparison before you lean on a locality’s overall number.
Sources & methodology
- Source
- Nexscore locality API (api.nexlease.in/api/nexscore/locality/:slug) — all six localities queried live for this piece
- Data as of
- 24 Aug 2026
- Last updated
- 26 Aug 2026
- Methodology
- Every row in the table below is fetched live from Nexscore's API at build time, via this site's shared data adapter — the same one every locality guide and article on this site uses. No figure here is typed in by hand or estimated.
- Limitations
- This covers 6 of the 17 Chandigarh Tricity localities Nexscore tracks, chosen to span its major sub-areas (central Chandigarh, Mohali, Panchkula, the Zirakpur/Kharar highway belt, and New Chandigarh) — it is not a full ranking of all 17. Building age and amenities are not in Nexscore's public data for any locality and are not part of this analysis.
Frequently asked questions
Does Nexscore measure air quality separately for each Tricity locality?
Not currently. Nexscore's AQI figure comes from one regional signal rather than per-sector monitoring, and the cached copy of it doesn't refresh the same way across every locality request — so don't read either matching or differing AQI numbers between localities as a real difference in air quality.
Which Tricity locality has the lowest flood risk among those covered here?
Check the table above — flood-risk scores do vary meaningfully locality to locality, unlike air quality, so this is one of the factors actually worth comparing directly.